

There are three steps:
1. Create a suitable image
Using your image processing program create the graphic
you want to use as the image map. It can be anything from a small strip of buttons
to a huge image that covers the entire screen area. When designing the graphic
it is important to keep the user in mind. Is it clear and concise? Are
the hot-spots easy to see?
Another thing to keep in mind is that just because
it looks great on your screen does not mean it will look great on the users
screen. Believe it or not! - some people are still using 14 inch monitors out there.
And many computers are set to run using only 256 colors, even when they are capable
of more. So if you want to make sure the graphics will appear as you intended them,
make them no more than 600 pixels wide and 400 pixels tall (that's a little less than a 640x480 screen, allowing room for the browser). And stick to a web-safe
cross-platform palette (216 colors)
When you are done save your graphic as either a JPEG (.jpg) or GIF (.gif) file. Each format has its advantages depending on the type of image you are saving. Use JPEG for colorful photographic images. Use GIF for line art and text. The graphic below is a good example of GIF-type graphic. Take a look here and see what I mean. Always try to keep the image file size small, since larger files take longer to transmit to the user.
2. Determine hot-spot areas
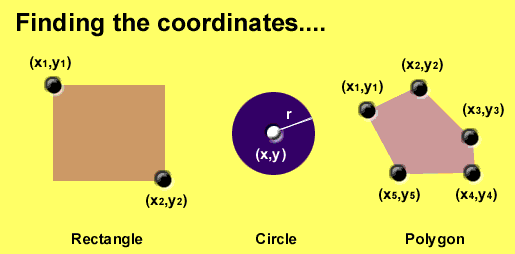
We need to determine the coordinates of the virtual shape that will be the "hot-spot" area. HTML allows for different shapes to be used. Each requires at least one set of coordinates, and in the case of the circle: a radius. Use the graphic below to determine what shape you want to use and what coordinates you will need.
Using your image processing program, determine the coordinates needed. In Photoshop this can be accomplished simply by opening the "Info" window and moving the mouse. Check the FAQ if this is unclear, or to read about a real easy way to find coordinates.
3. Add HTML code
The final step is to add the HTML code needed to activate the image map on your web page. Open up your page in a HTML editor and add these lines to create a map:
|
Now add an entry for each "hot-spot" using this syntax:
|
In the above example "Rect" refers to a rectangle.
"HREF" is where this "hot-spot" will direct the user. Sets of coordinates are
separated by spaces. Here are some more examples:
|
As a last example here is the complete code for the image map on the first page of this tutorial:
|
With your map ready you have to add one last piece of code,
assigning the map to your image. Simply add a USEMAP line to your IMG
tag.
|
(Note that I added a tag called BORDER=0. Without this tag some browsers will display an ugly blue border around your image.)
Finally you will need to test the image map in your browser. You should find a functional image map ready for use.
Well, that's the end of the tutorial. Hope you found it easy to use and learned from it. In order for me to improve the page in the future, I would ask you complete the Evaluation
What is it? - What do I need? - How do I do it? - Credits/F.A.Q.
Back to the Kasparius Tutorials Main Page